library(ggplot2)ggplot2 is a powerful tool to visualize data. Today I would like to show how to make a boxplot and then overlay points.
A pure boxplot
First, let’s make a boxplot. We will use the data set ToothGrowth coming with
R.
dat<-ToothGrowth
dat$dose<-as.factor(dat$dose) # convert the dose to a factor
plt<-ggplot(dat, aes(x=dose, y=len, fill=supp)) + theme_bw()
plt<-plt + geom_boxplot()
plt
add points with geom_jitter()
Now let’s add points over the boxplots with the function
geom_jitter(). Here we use the function position_jitter()
to control the points’ spreads.
plt + geom_jitter(position = position_jitter(width=0.4), pch=24, size=2, alpha=0.6)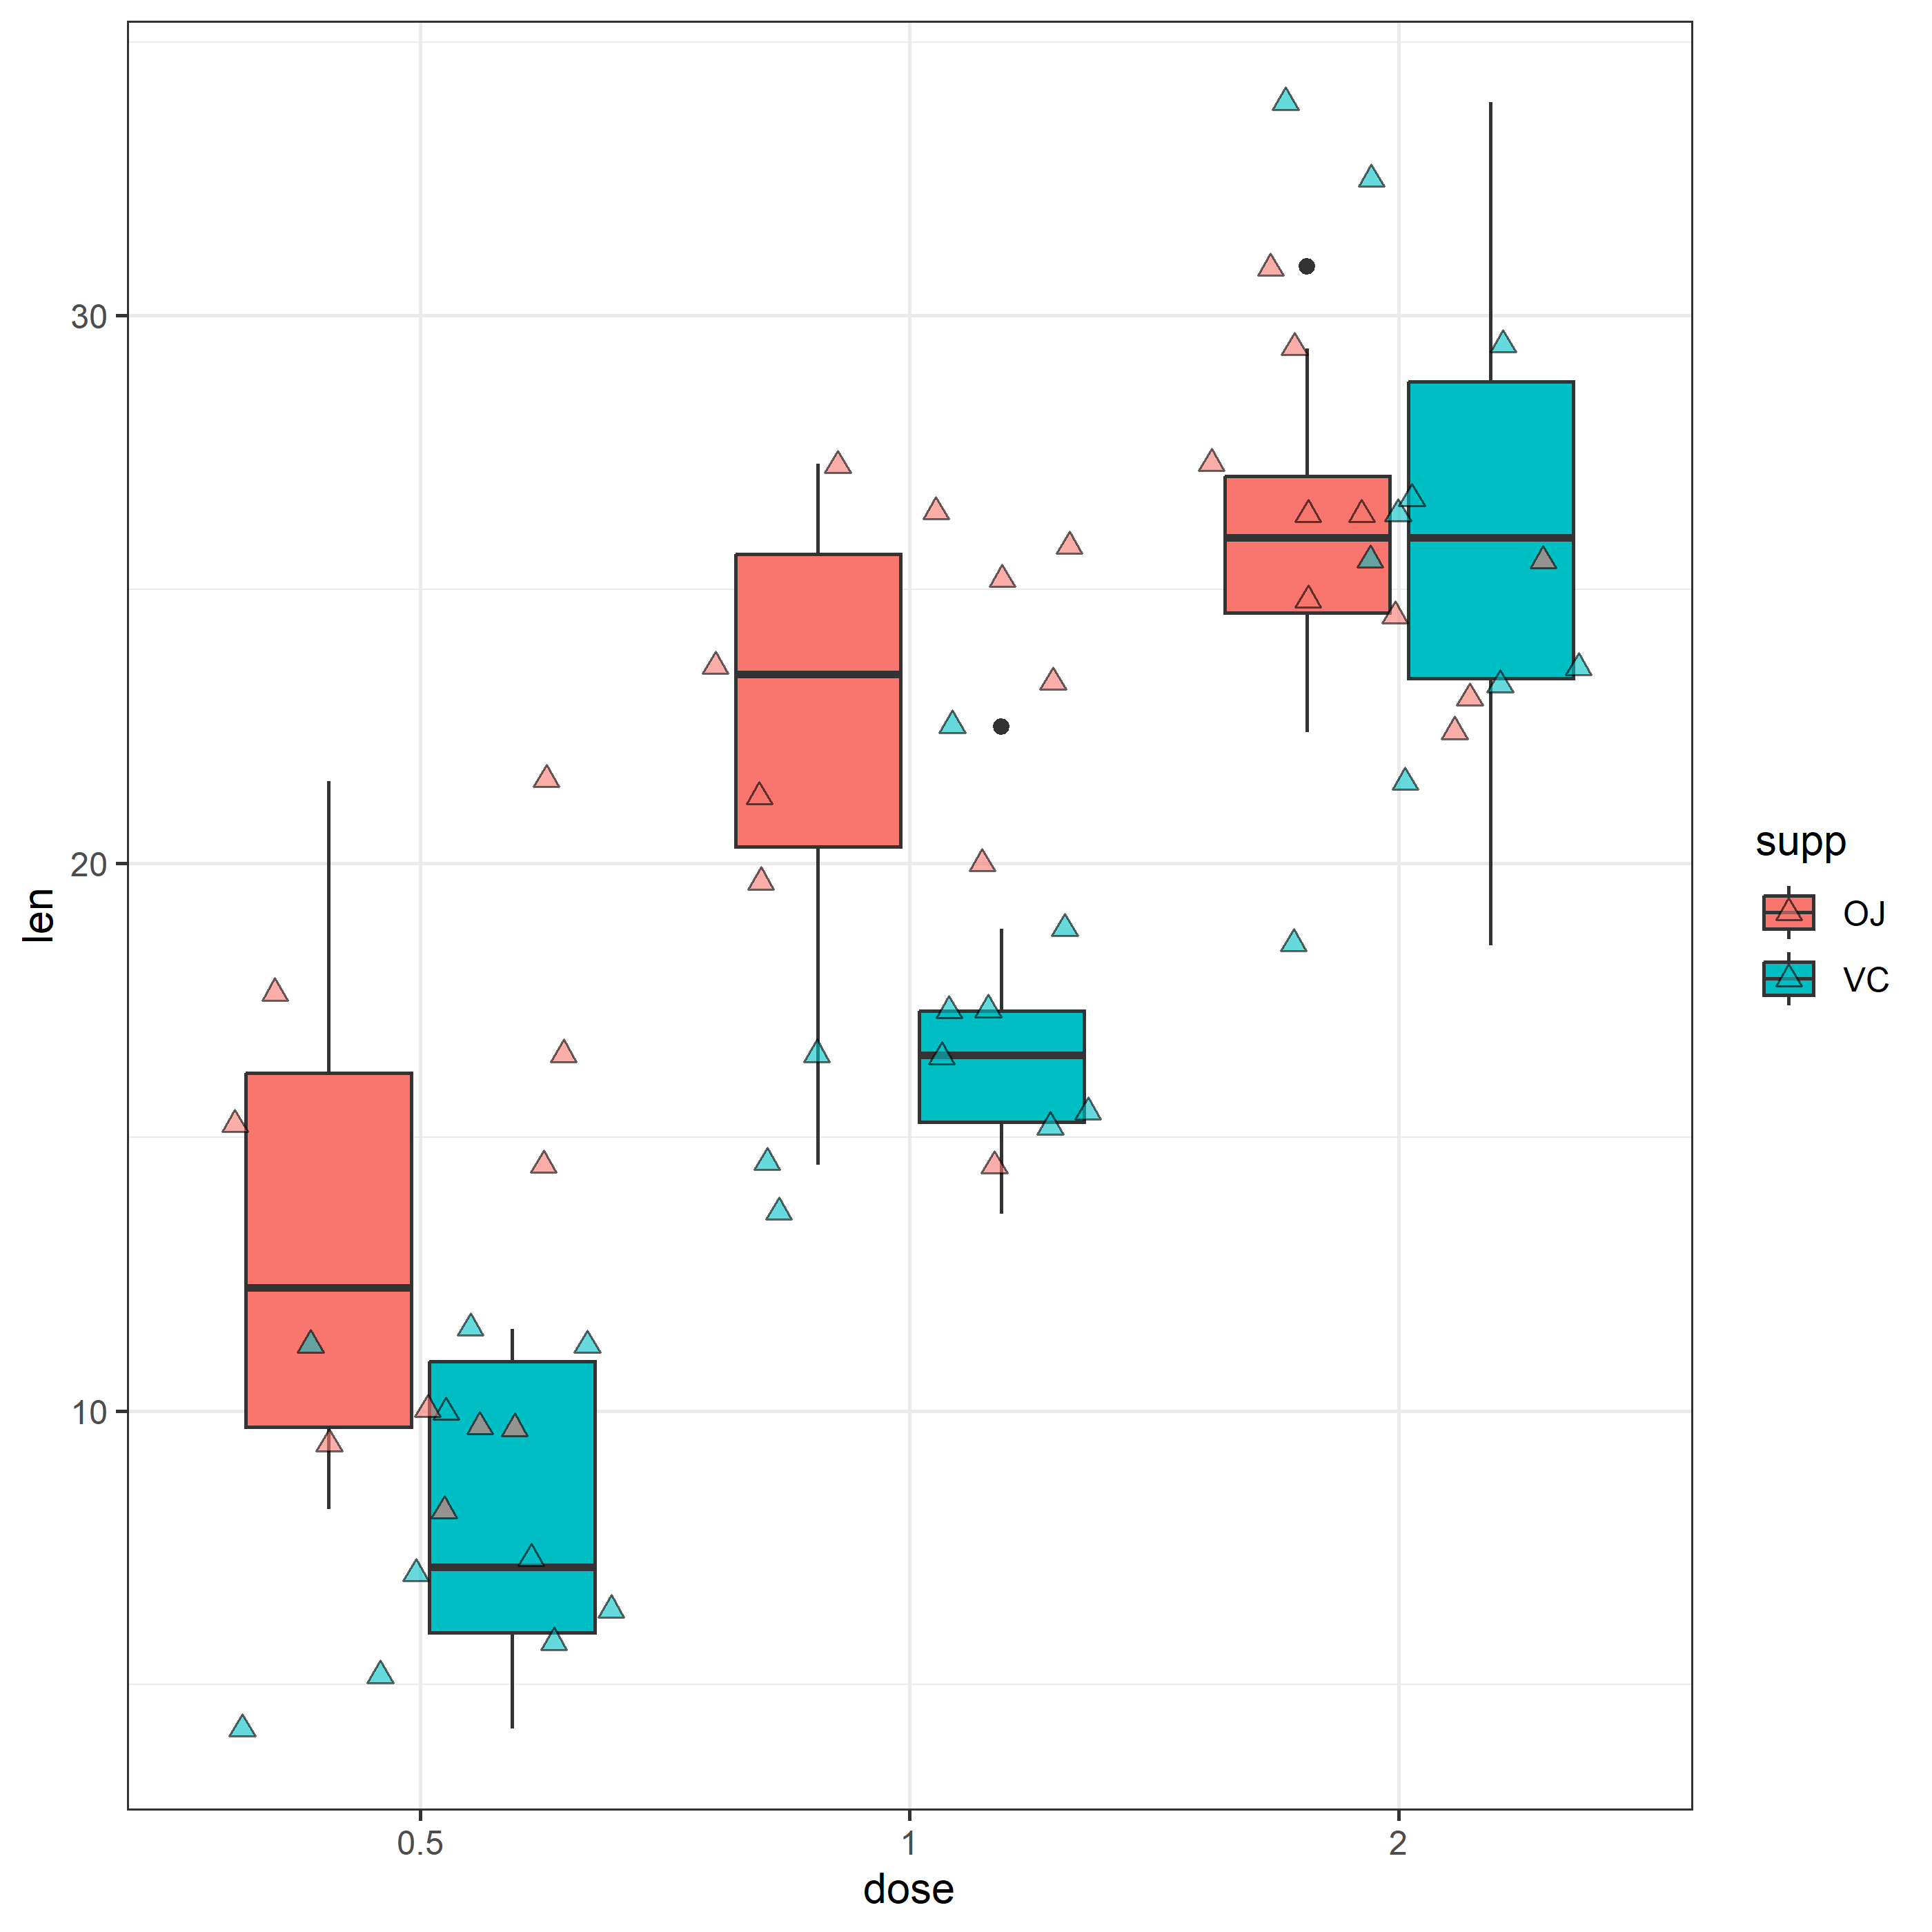
This doesn’t look right, because the points are superimposed over both boxes in each dose level; they are supposed to be separated by the factor ‘supp’.
Now let’s try a different function position_jitterdodge()
plt + geom_jitter(position = position_jitterdodge(jitter.width=0.4), pch=24, size=2, alpha=0.6)
This looks good, right. Note that we used ‘fill’ to control the colors of both boxplots and points, so the selected points by ‘pch’ should have a property of fill.
Add points with geom_point()
We can also use geom_point() plus position_jitterdodge() to make similar
plots, as below:
plt + geom_point(position = position_jitterdodge(jitter.width=0.4), pch=24, size=2, alpha=0.6)
The function position_jitterdodge() provides jitter effects, and the degree of
spread can be tuned with the parameter jitter.width, default is 0.4. Let’s try
a smaller number 0.2.
plt + geom_point(position = position_jitterdodge(jitter.width=0.2), pch=24, size=2, alpha=0.6)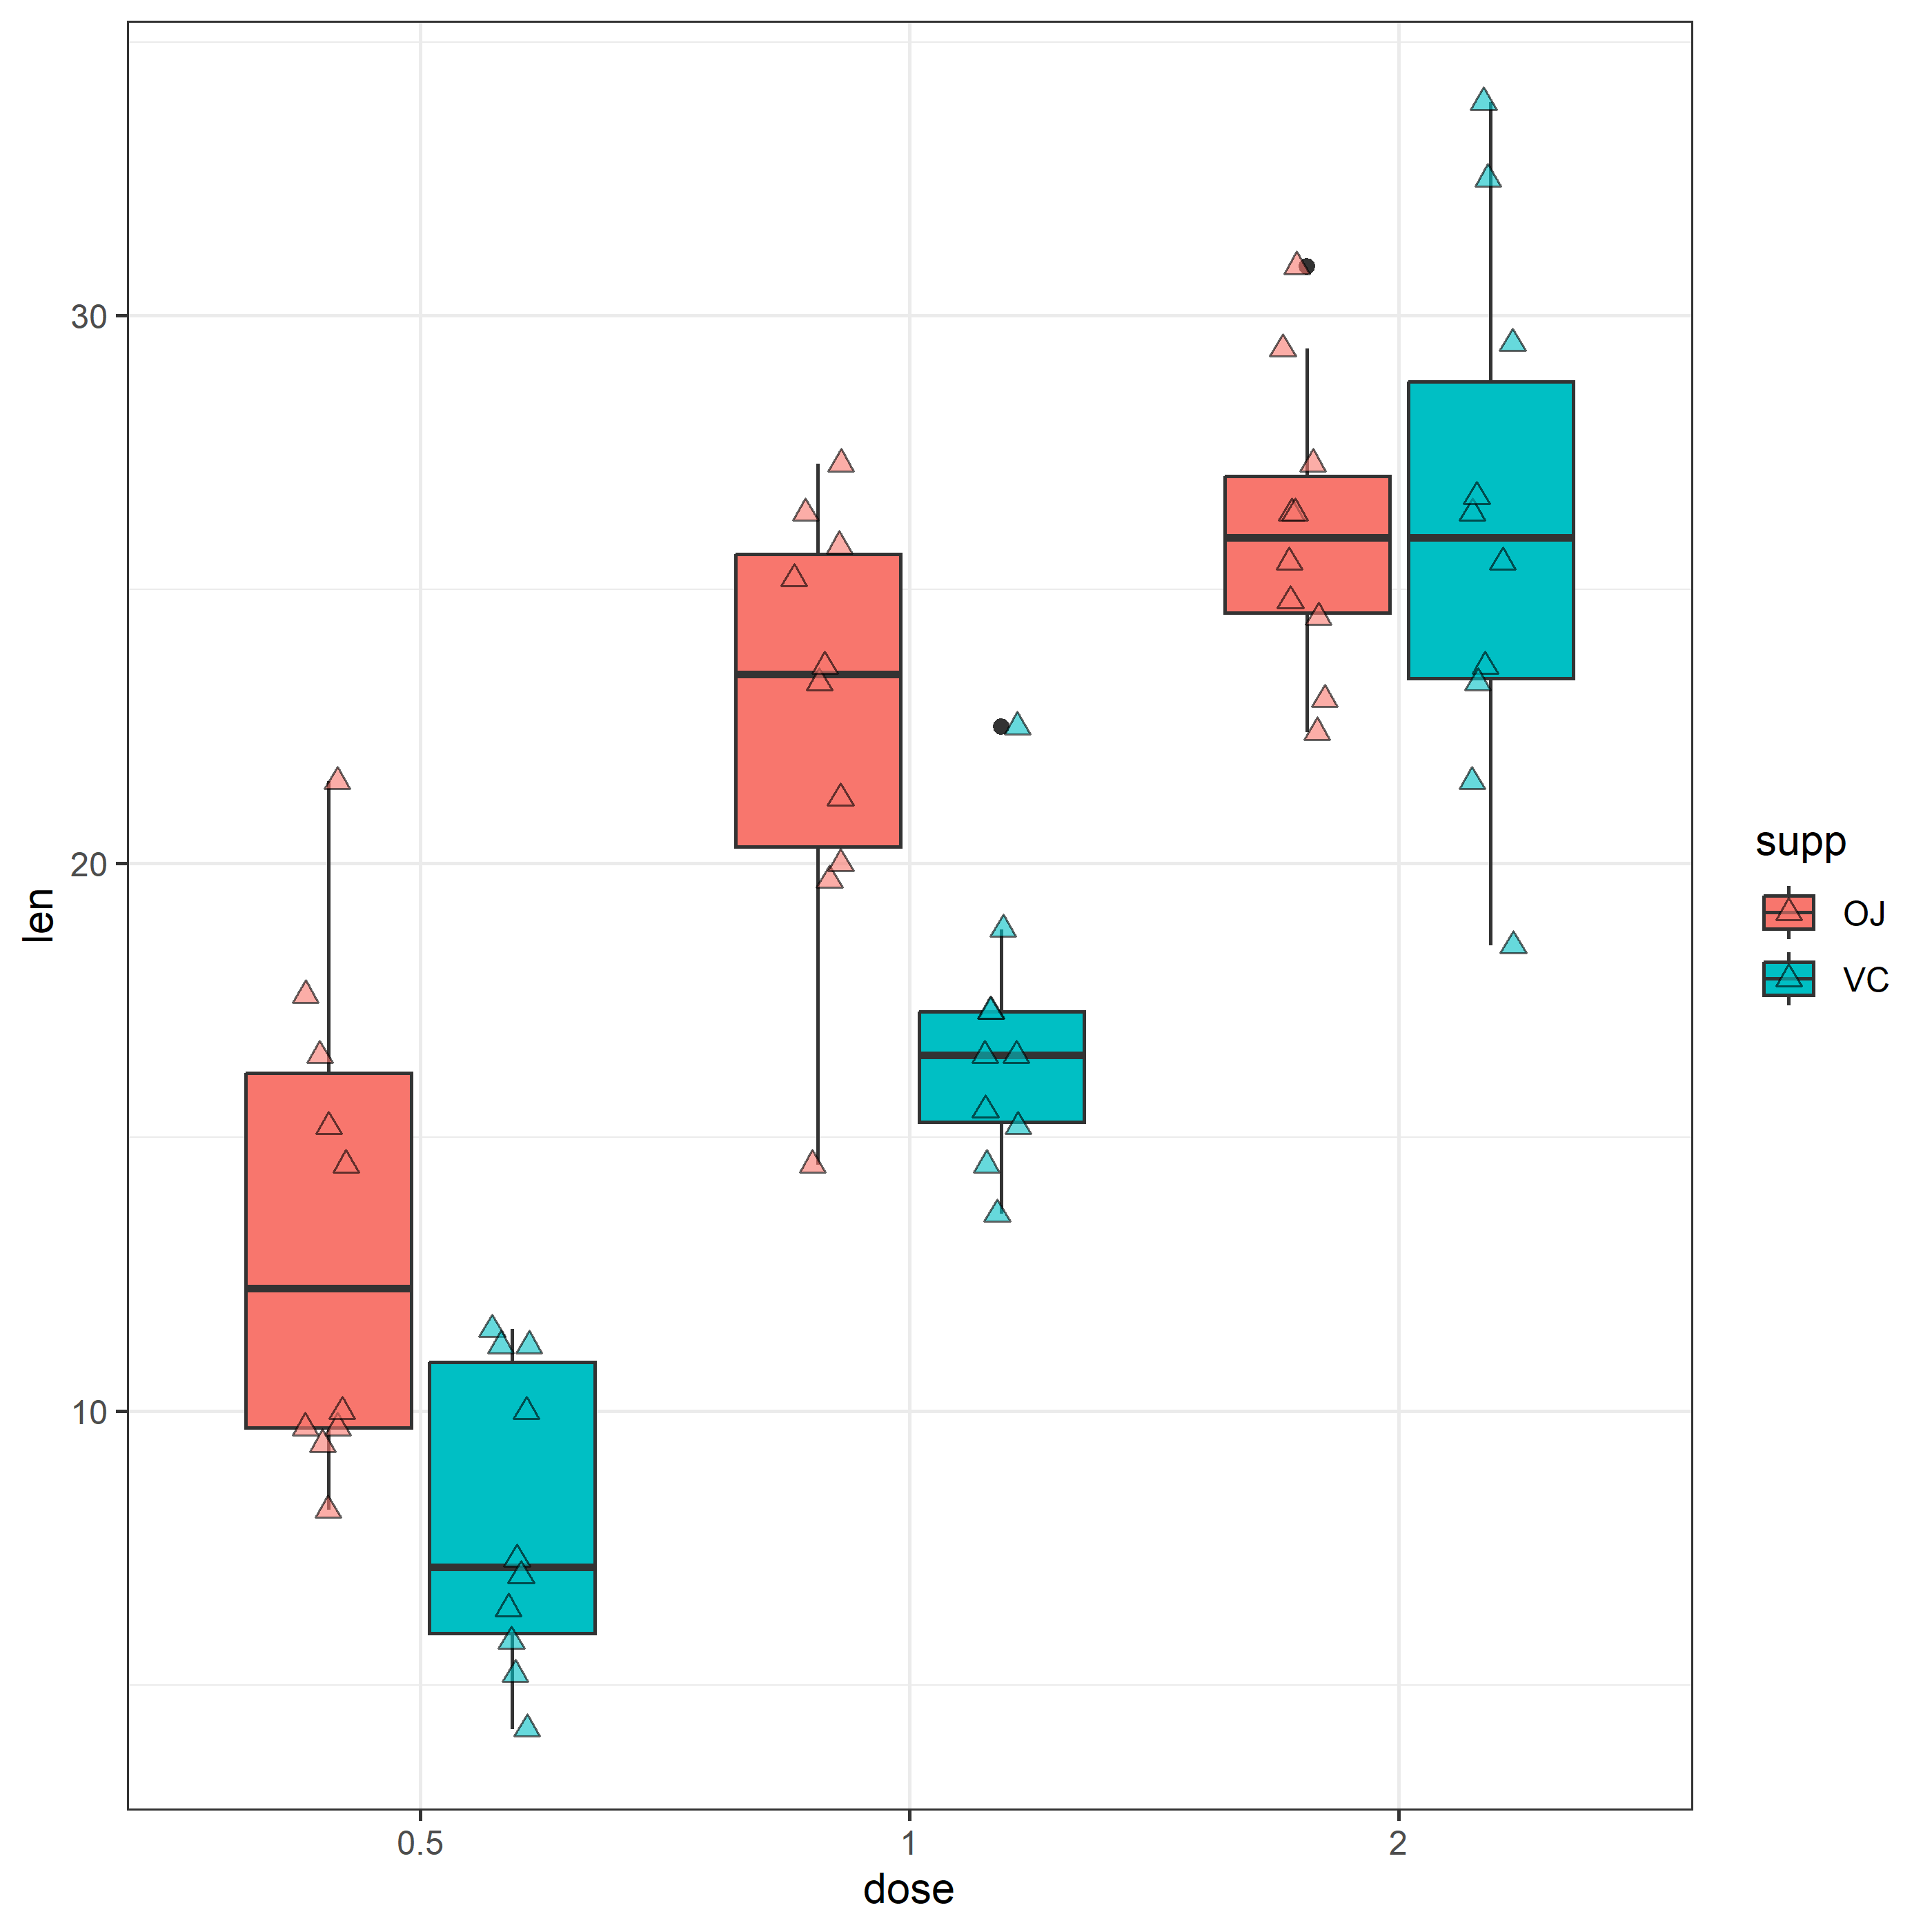
As you can see, the points are clustered more narrowly in the horizontal direction.
The categorical variable should be a factor
There is a caveat here. The variable used for specifying filling color must be a factor, otherwise the points will not be grouped correctly.
Let’s create a new variable supp2, which is a character version of supp,
and use supp2 for color fill.
dat$supp2<-as.character(dat$supp)
plt<-ggplot(dat, aes(x=dose, y=len, fill=supp2)) + theme_bw()
plt<-plt + geom_boxplot()
plt + geom_point(position = position_jitterdodge(jitter.width=0.4), pch=24, size=2, alpha=0.6)
As you can see, the points are spreaded out, even though the same parameter
jitter.width was given. Let’s try a smaller value 0.2
plt + geom_point(position = position_jitterdodge(jitter.width=0.2), pch=24, size=2, alpha=0.6)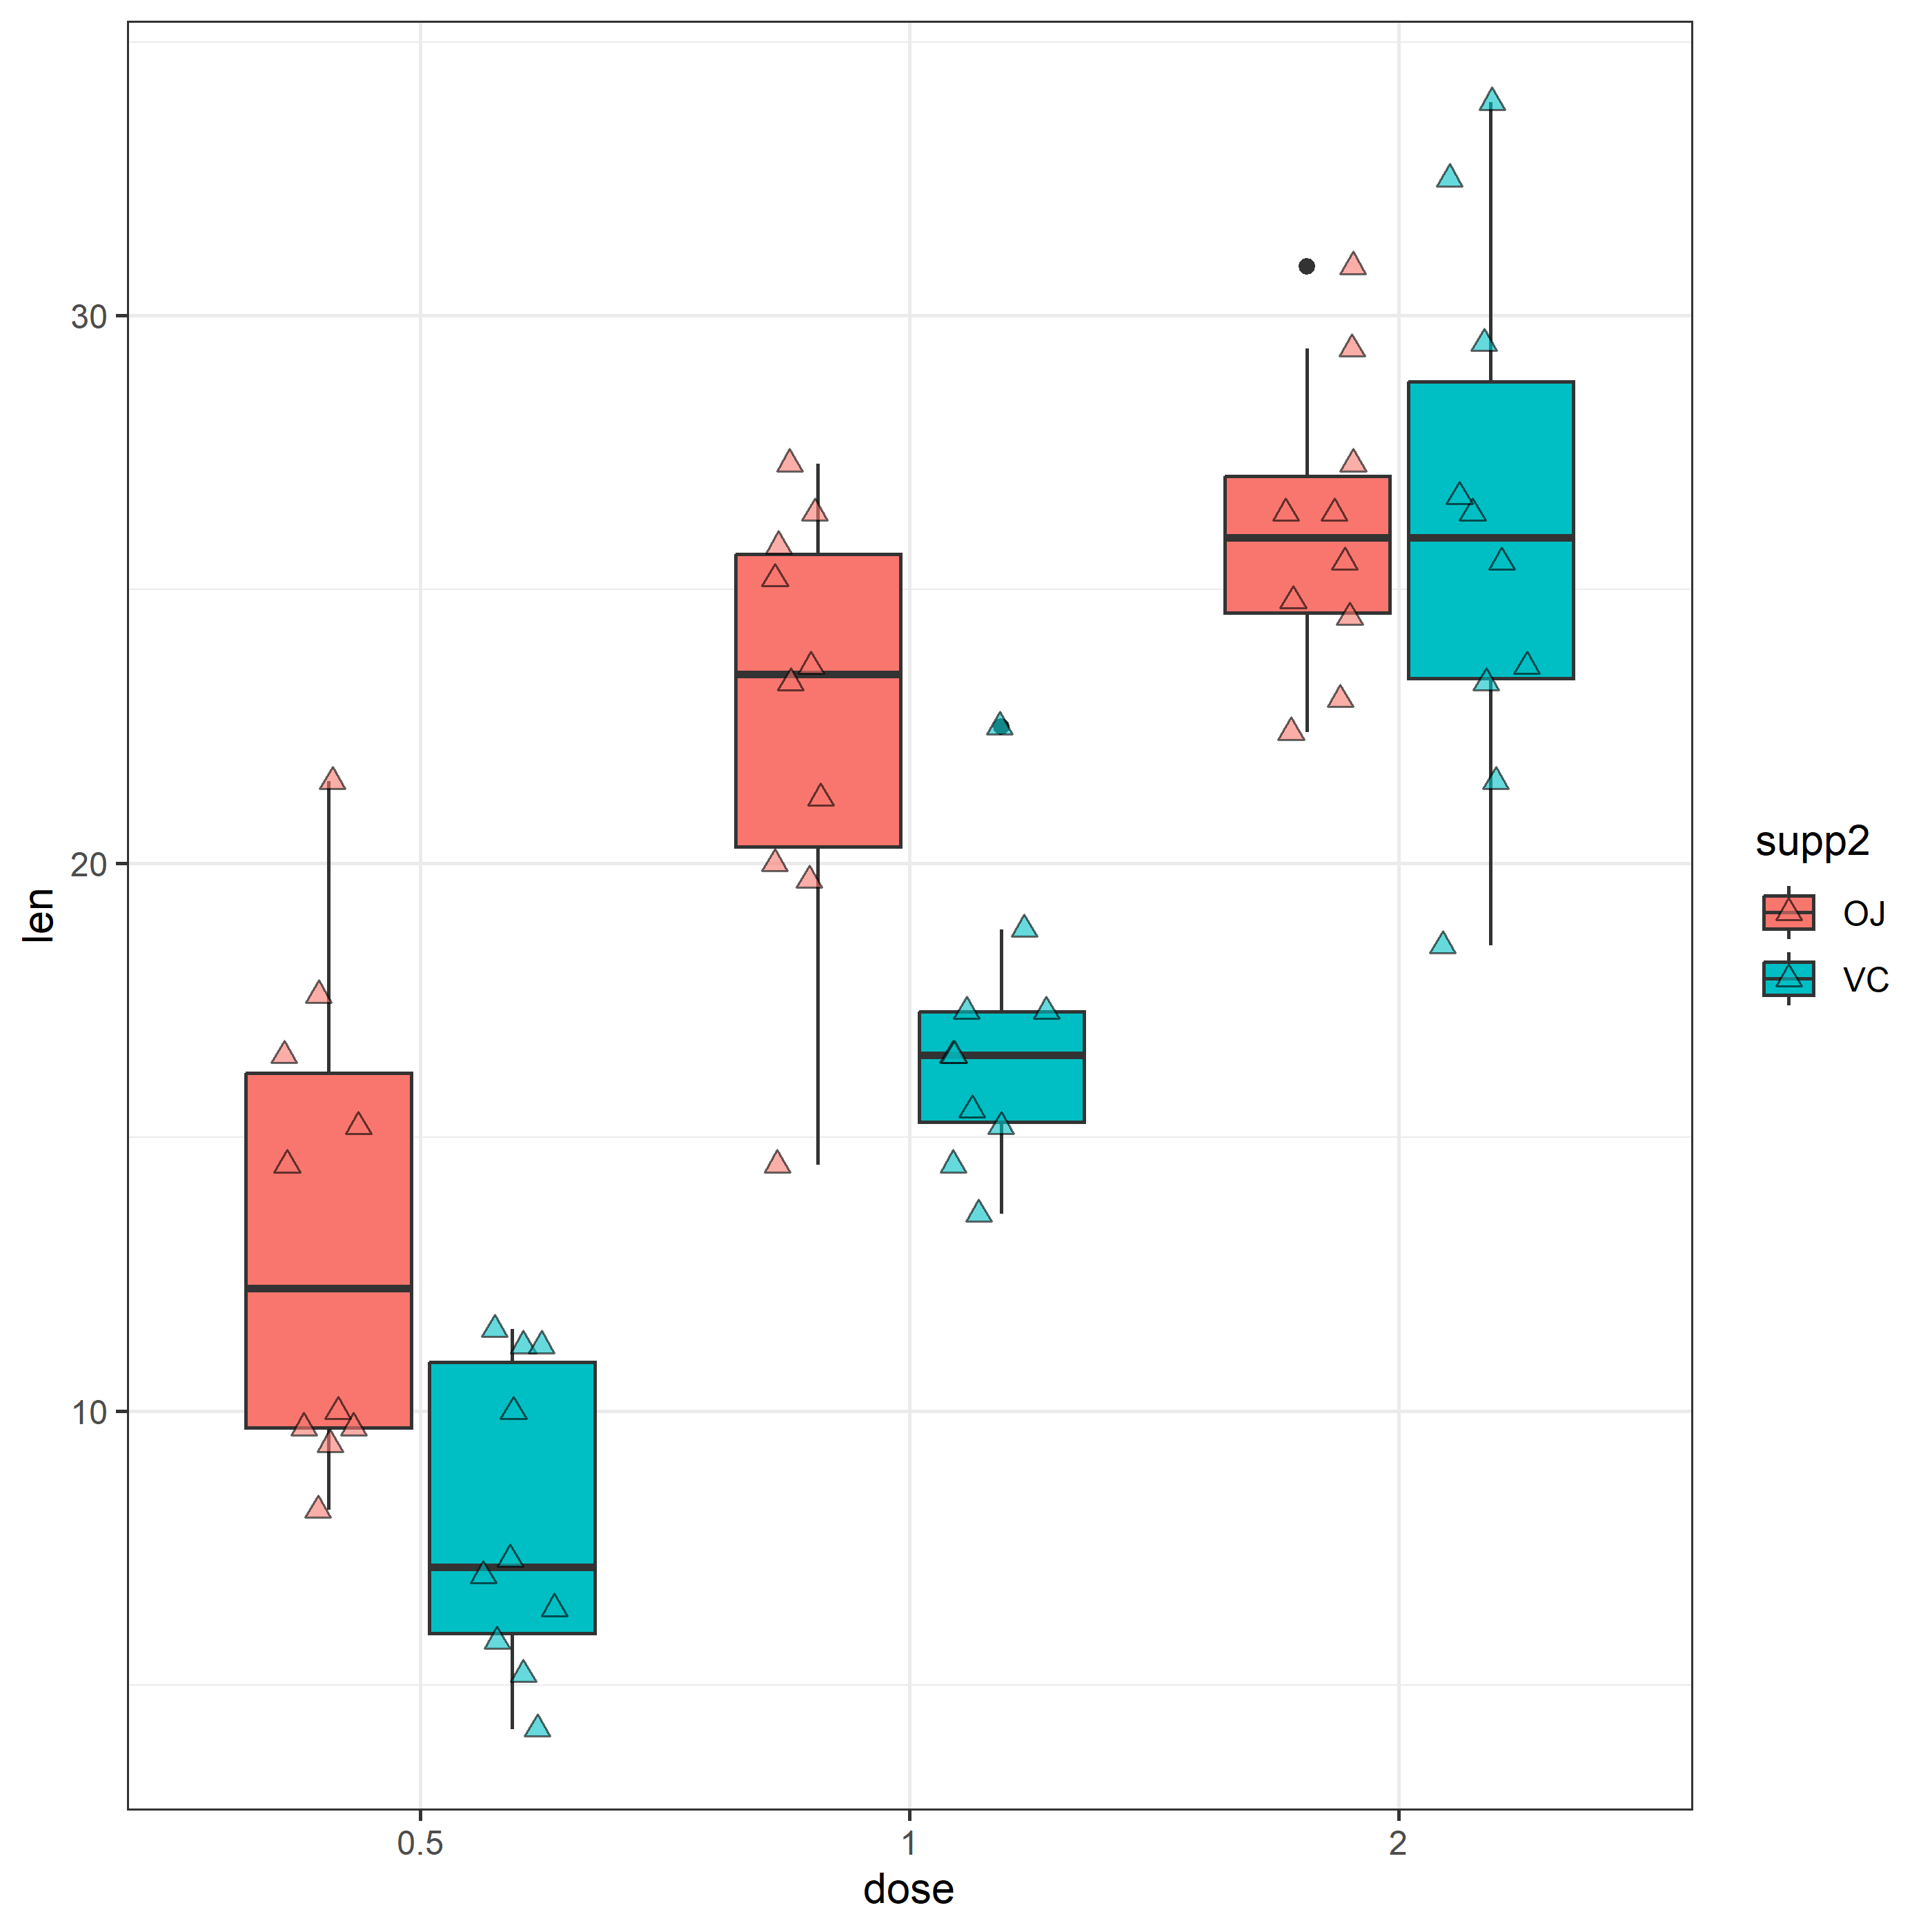
This helps a bit.
Conclusions
To make boxplot with superimposed points, one need use the function
position_jitterdodge() to specify point positions, with this both
geom_point() and geom_jitter() can be used.
Also the group variables used for specifying colors or filling colors should be a factor, not character; otherwise some unexpected behavior may happen.
Happy Programming 😄 👍
References
- ggplot2 boxplot quick start: http://www.sthda.com/english/wiki/ggplot2-box-plot-quick-start-guide-r-software-and-data-visualization
Last modified on 2023-08-26