knitr::opts_chunk$set(echo=T, fig.align = "center", fig.width = 6, fig.height = 5, dpi=150, warning=FALSE)library(knitr)
library(ggplot2)How to use variables to refer columns in ggplot2
Let’s start an example of making a scatter plot by using the
dataset mtcars.
head(mtcars)## mpg cyl disp hp drat wt qsec vs am gear carb
## Mazda RX4 21.0 6 160 110 3.90 2.620 16.46 0 1 4 4
## Mazda RX4 Wag 21.0 6 160 110 3.90 2.875 17.02 0 1 4 4
## Datsun 710 22.8 4 108 93 3.85 2.320 18.61 1 1 4 1
## Hornet 4 Drive 21.4 6 258 110 3.08 3.215 19.44 1 0 3 1
## Hornet Sportabout 18.7 8 360 175 3.15 3.440 17.02 0 0 3 2
## Valiant 18.1 6 225 105 2.76 3.460 20.22 1 0 3 1We can make a plot using the following commands
plt<-ggplot(mtcars, aes(x=wt, y=mpg, color=factor(cyl))) + theme_bw()
plt<-plt+geom_point()
plt
If we create a function, how can we make the sample plot:
use ‘{{}}’
make_scatter_plot1<-function(colorVar) {
  plt<-ggplot(mtcars, aes(x=wt, y=mpg, color=factor({{colorVar}}))) + theme_bw()
  plt<-plt+geom_point()
  plt
}
make_scatter_plot1(cyl)
The embrace operator ‘{{’ is used to create functions that call other data-masking functions. It transports a data-masked argument (an argument that can refer to columns of a data frame) from one function to another.
use .data
make_scatter_plot2<-function(colorVar) {
  plt<-ggplot(mtcars, aes(x=wt, y=mpg, color=factor(.data[[colorVar]]))) + theme_bw()
  plt<-plt+geom_point()
  plt
}
make_scatter_plot2("cyl")
use sym()
make_scatter_plot3<-function(colorVar) {
  plt<-ggplot(mtcars, aes(x=wt, y=mpg, color=factor(!!sym(colorVar)) )) + theme_bw()
  plt<-plt+geom_point()
  plt
}
make_scatter_plot3("cyl")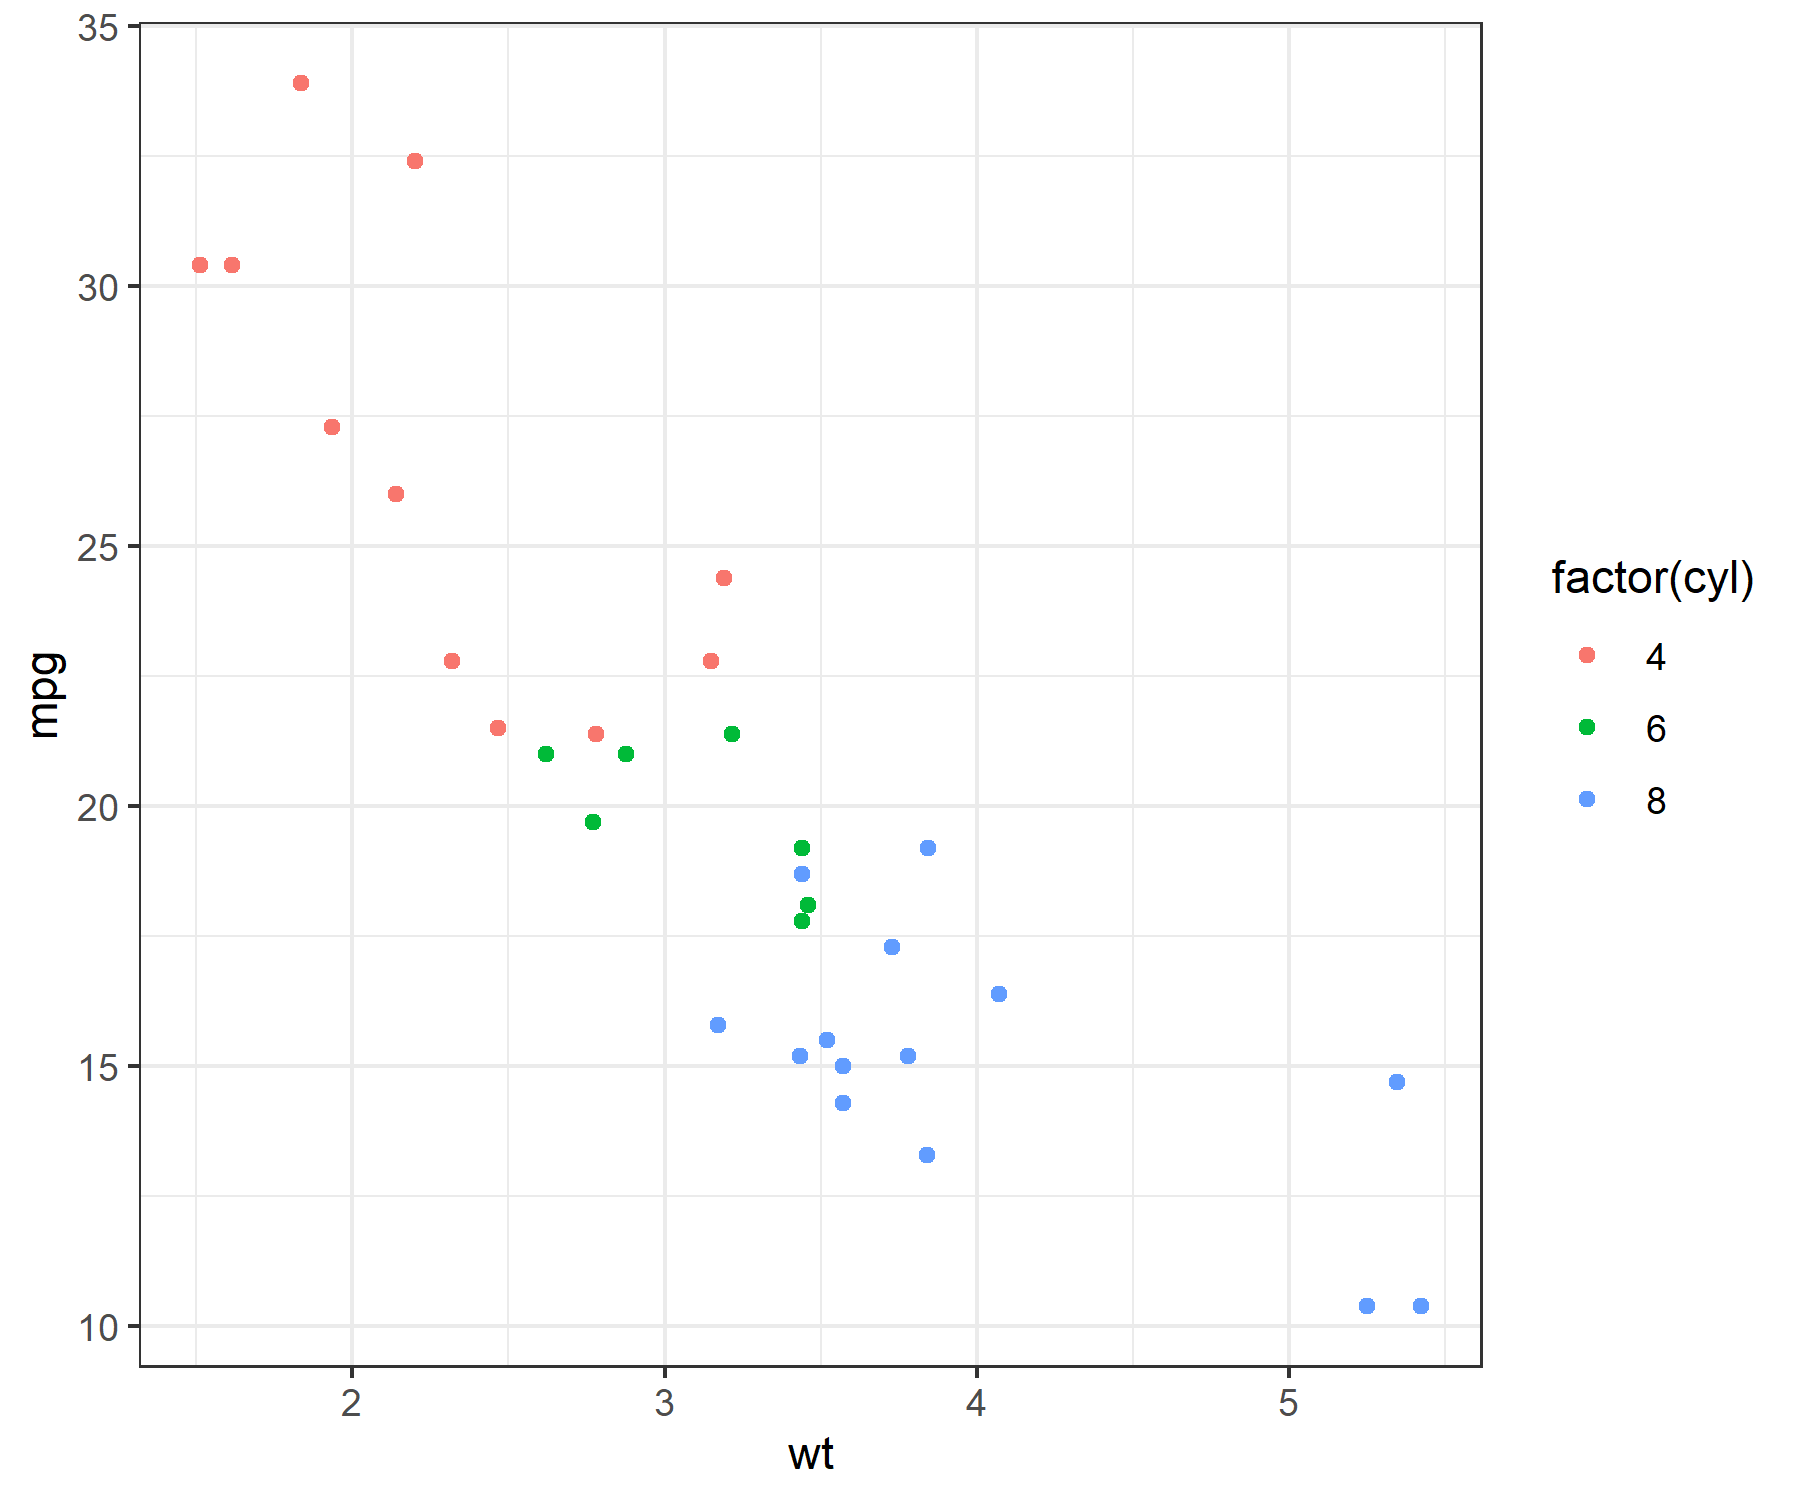
use quo()
make_scatter_plot4<-function(colorVar) {
  plt<-ggplot(mtcars, aes(x=wt, y=mpg, color=factor(!!colorVar) )) + theme_bw()
  plt<-plt+geom_point()
  plt
}
myvar<-quo(cyl)
make_scatter_plot4(myvar)
Key concepts
defusing
When a piece of R code is defused, R doesn’t return its value, but returns the expression in a tree-like object to describe how to compute a value, which can be evaluated later in a specific environment.
For example, one can use expr() to create a defused object.
# return result
1+1
## [1] 2# return defused object
expr(1+1)## 1 + 1One application of using defused object is to resume its evaluation in data mask, see the example below:
e <- expr(mean(cyl))
eval(e, mtcars)
## [1] 6.1875Some functions defuse their arguments, and when these function are called from
another function, its argument must be provided with embrace operator {{, which
is a combination of enquo() and !!.
Defused expressions can also be created by using other functions
such as sym() and call(), for example:
# create a symbol
vName<-"mtcars"
sym(vName)

# make a call
call("head", sym(vName))
There are two ways to defuse expressions, one can use
expr() to defuse one’s own expression and use enquo() to defuse user-provided
expressions to your function.
Defusing is known as quoting in other frameworks.
The equivalent of
expr()is [base::bquote()].The equivalent of
enquo()is [base::substitute()]. The latter returns a naked expression instead of a quosure.There is no equivalent for enquos(…) but you can defuse dots as a list of naked expressions with eval(substitute(alist(…))).
data-masking
Data masking means that a data.frame is inserted at the bottom of the current chain of environment and it takes higher precedence than the user environment.
For example, if we assign a value to a variable, but this variable is invisible in data-masking functions as below:
mpg<-100
# the following function can't see it
dplyr::summarise(mtcars, mean(mpg))
## mean(mpg)
## 1 20.09062As you can see, the function used the column mpg from the dataframe mtcars.
One way to disambiguate the user and mask environments is to use tidy eval pronouns.
dplyr::summarise(mtcars, mean(.env$mpg))## mean(.env$mpg)
## 1 100Summary
Basically, when one wants to evaluate a variable in a different context, he should
defuse the variable (using function such as quo() and enquo()) and
then inject it (using {{}}, !!, !!sym(), etc) when evaluation is needed.
References
Using ggplot2 in packages: https://ggplot2.tidyverse.org/articles/ggplot2-in-packages.html
Functional programming: https://dcl-prog.stanford.edu/tidy-eval-detailed.html
Defuse and inject patterns: https://search.r-project.org/CRAN/refmans/rlang/html/topic-metaprogramming.html
Data-masking programming: https://search.r-project.org/CRAN/refmans/rlang/html/topic-data-mask-programming.html
Last modified on 2023-11-11