In ggplot2, when displaying grouped data along categorical axes (such as grouped bar charts, boxplots, or error bars), horizontal dodging is used to prevent elements from overlapping at each categorical position. ggplot2 provides two primary dodging position functions: position_dodge() and position_dodge2().
In this post, we will explore:
- How the
widthparameter inposition_dodge()interacts with the parent geom’swidth. - The core differences between
position_dodge2()andposition_dodge(), including why changingwidthinposition_dodge2()often has no visual effect. - How
preserve = "single"behaves when elements of a group variable are missing at a given x-axis level.
Definition of Terms
To keep our explanations clear and consistent throughout this post, we define two key concepts:
- x-axis level: The discrete value or category on the x-axis. In our examples using
mtcars, the x-axis level iscyl(with levels4,6, and8). - group variable: The variable that divides items into subgroups at each x-axis level, typically mapped to an aesthetic like
fillorcolor. In our examples, the group variable isgear(with levels3,4, and5). - dodged elements: The individual visual marks (e.g. bars) corresponding to each level of the group variable at a specific x-axis level.
library(ggplot2)
library(patchwork)
1. The width Parameter in position_dodge()
What does width control?
In position_dodge(width = ...), width specifies the total dodging span (interval) on the x-axis into which all dodged elements for a given x-axis level are arranged side-by-side.
By default, if you do not explicitly supply width to position_dodge(), it inherits its value from the parent geom (e.g., geom_bar() defaults to width = 0.9).
Interaction between geom_bar(width) and position_dodge(width)
geom_bar(width = ...): Sets the total physical width allocated to the bars at each x-axis level. The individual bar width is derived by dividing this value by the number of elements at that x-axis level.position_dodge(width = ...): Sets the total span on the x-axis across which the center positions of the dodged elements are calculated and spaced.
Both parameters use x-axis coordinate units (where the distance between adjacent discrete x-axis levels is 1.0).
Let’s examine how varying both parameters affects the layout using the mtcars dataset (plotting mean mpg across x-axis level cyl, with group variable gear mapped to fill):
# Base plot configuration
base_p <- ggplot(mtcars, aes(x = factor(cyl), y = mpg, fill = factor(gear))) +
  labs(x = "Cylinders (x-axis level)", y = "Mean MPG", fill = "Gear (group variable)") +
  theme_minimal(base_size = 11)

# Case 1: Default matching widths (0.9 / 0.9)
# Bars touch neatly within each x-axis level
p1 <- base_p +
  geom_bar(
    stat = "summary",
    fun = "mean",
    width = 0.9,
    position = position_dodge(width = 0.9)
  ) +
  ggtitle("1. Matching widths (0.9 / 0.9)", subtitle = "Bars touch neatly within each x-axis level")

# Case 2: geom_bar width (0.5) < dodge width (0.9)
# Dodging span is 0.9, but bars are narrower -> gaps appear between bars
p2 <- base_p +
  geom_bar(
    stat = "summary",
    fun = "mean",
    width = 0.5,
    position = position_dodge(width = 0.9)
  ) +
  ggtitle("2. geom_bar(0.5) < dodge(0.9)", subtitle = "Gaps created between dodged elements")

# Case 3: geom_bar width (0.9) > dodge width (0.5)
# Dodging span is narrower than bar widths -> bars overlap
p3 <- base_p +
  geom_bar(
    stat = "summary",
    fun = "mean",
    width = 0.9,
    position = position_dodge(width = 0.5)
  ) +
  ggtitle("3. geom_bar(0.9) > dodge(0.5)", subtitle = "Dodged elements overlap")

# Case 4: Both changed to 0.6
# Group as a whole is narrower, bars touch, larger separation between x-axis levels
p4 <- base_p +
  geom_bar(
    stat = "summary",
    fun = "mean",
    width = 0.6,
    position = position_dodge(width = 0.6)
  ) +
  ggtitle("4. Both set to 0.6", subtitle = "Compact cluster, wider space between x-axis levels")

(p1 | p2) / (p3 | p4)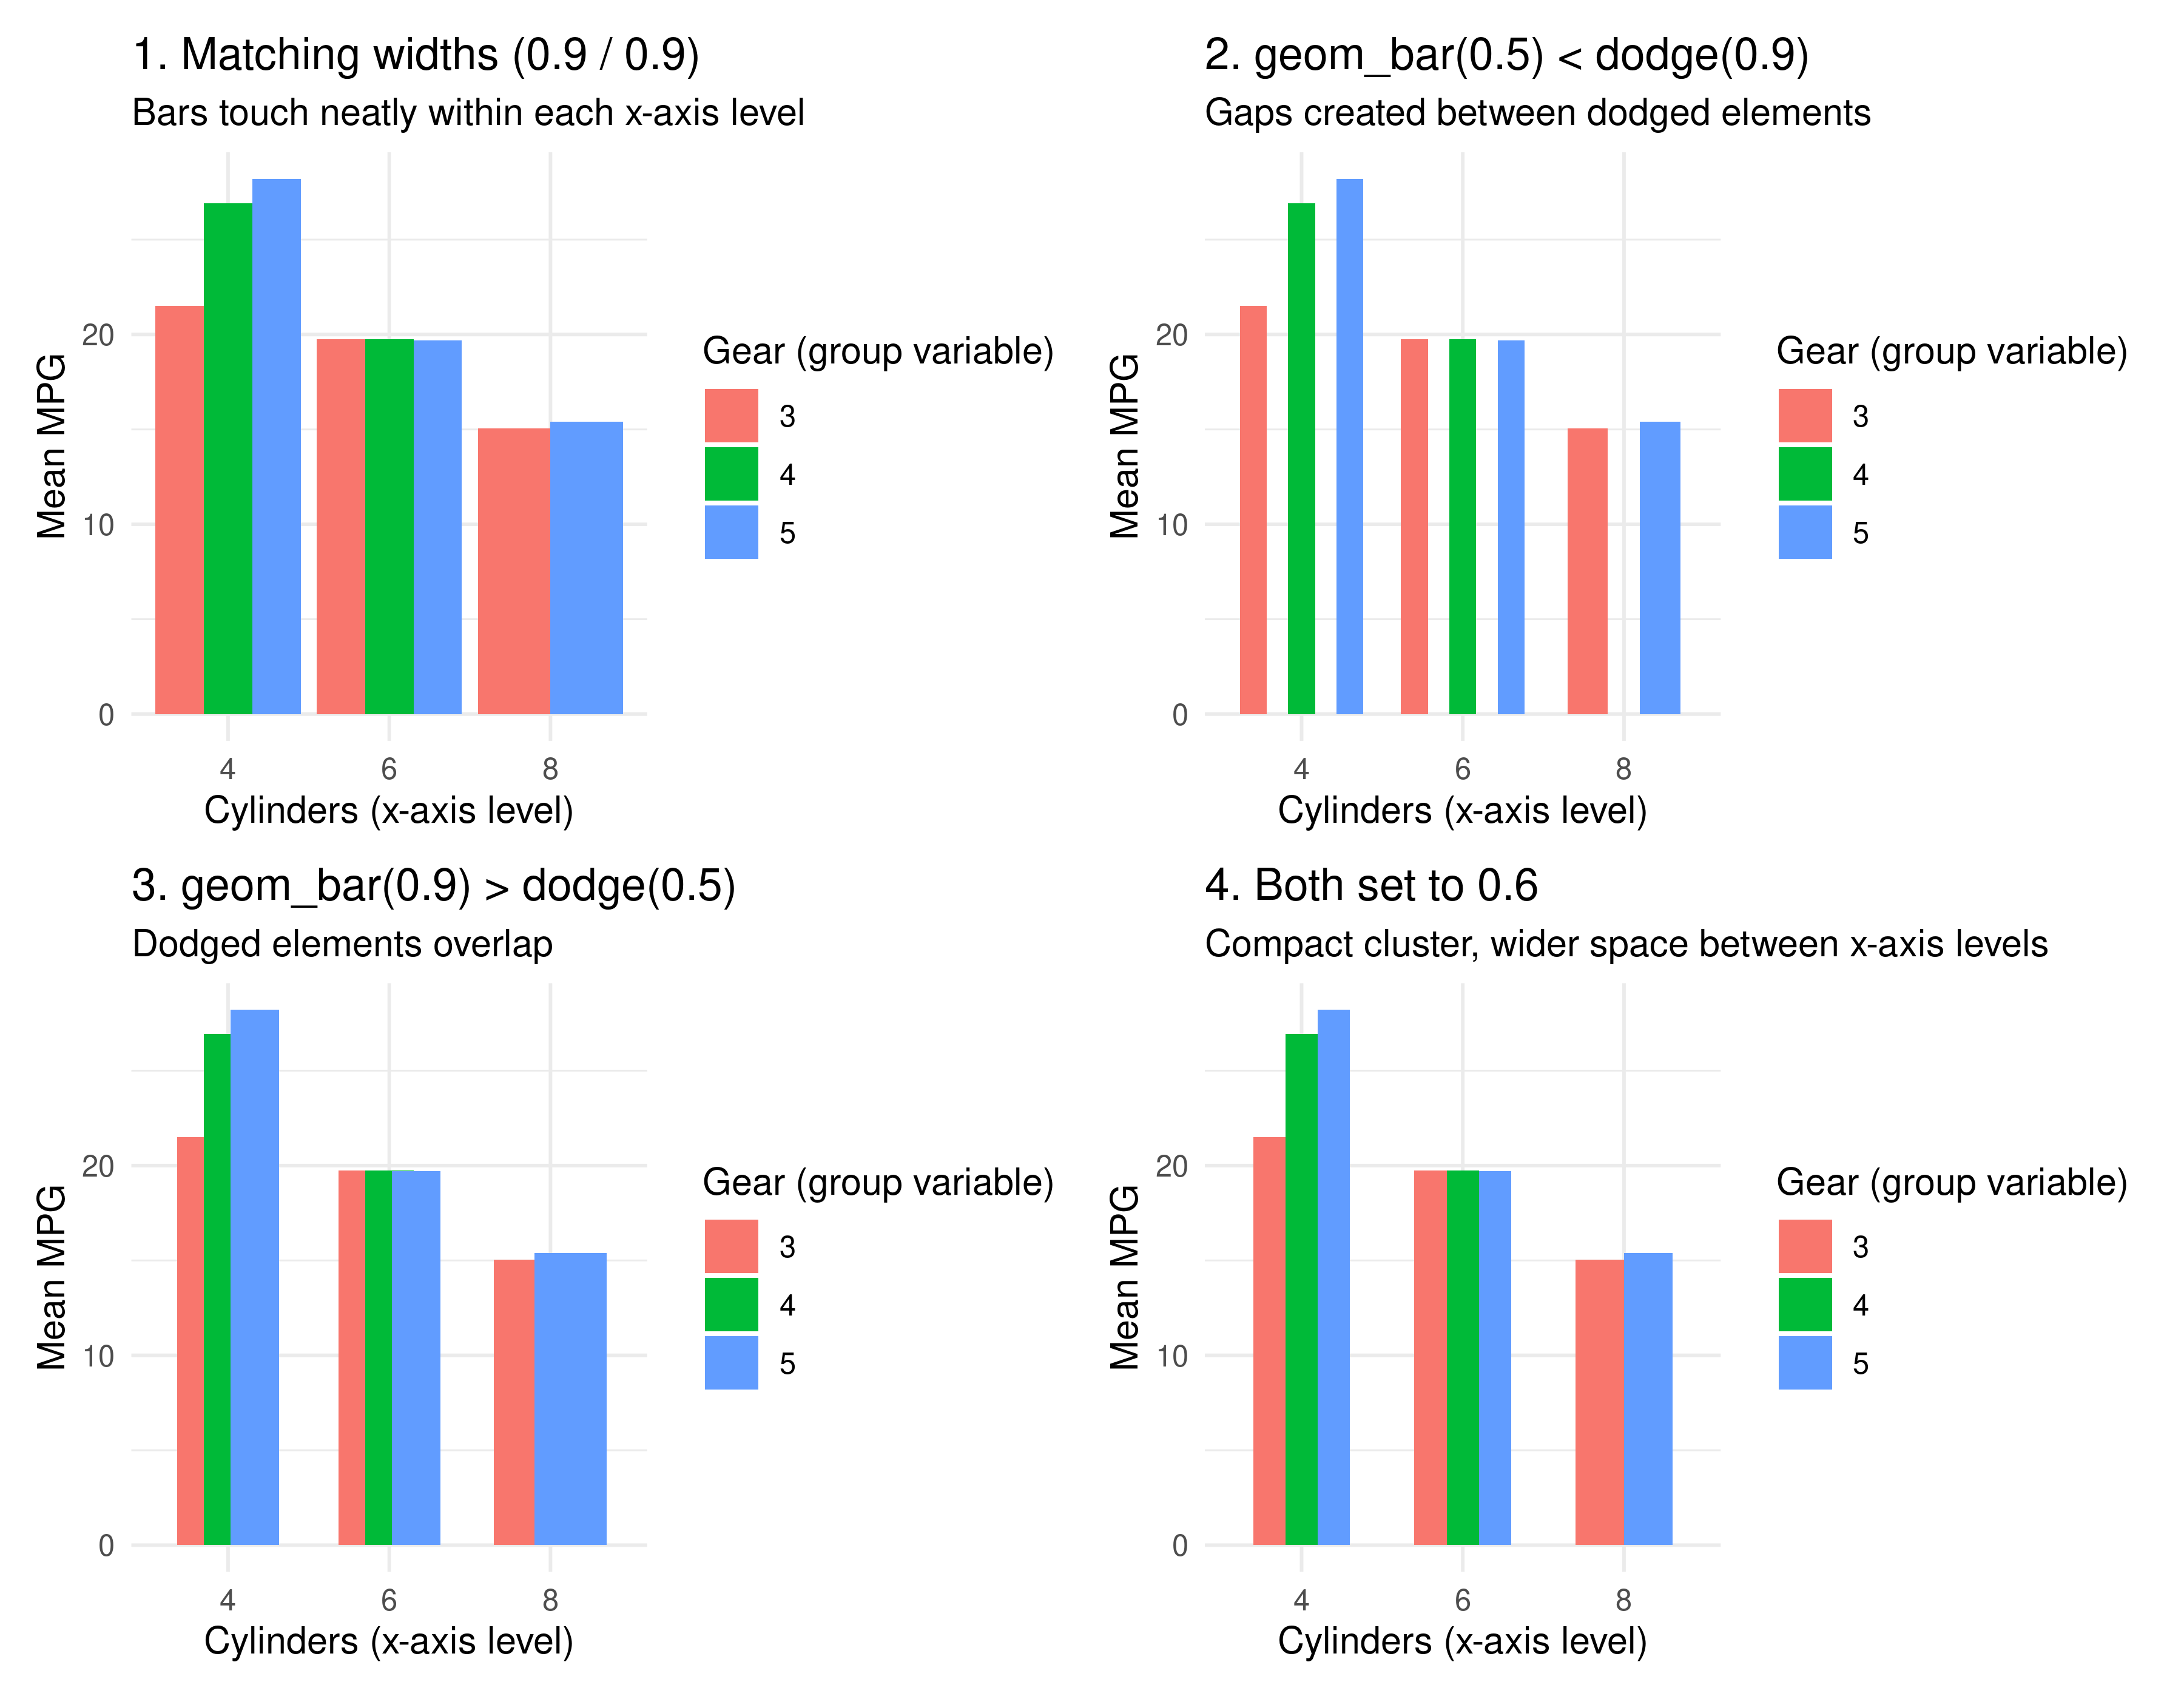
As demonstrated:
- Increasing width in geom_bar() increases the individual width of dodged elements at that x-axis level.
- Increasing width in position_dodge() increases the total dodging span across which elements are spread.
- When both values are equal, the dodged elements within each x-axis level touch each other without overlapping or leaving gaps.
2. Differences Between position_dodge2() and position_dodge()
While position_dodge() was originally designed for simple geoms with fixed-width positions (like geom_bar and geom_col), position_dodge2() was introduced to handle geoms with variable widths or explicit intervals (xmin to xmax), such as geom_boxplot(), geom_rect(), and geom_linerange().
Key Differences:
- Boundary-Based Packing vs. Fixed Slot Offsets:
position_dodge()divides the total dodge width at an x-axis level into fixed slots and places each level of the group variable into its designated slot.position_dodge2()packs elements (for different levels of the group variable) sequentially side-by-side using the bounding boxes of the geoms.
- The
widthParameter Has No Visual Effect inposition_dodge2()with Bars:- Because
position_dodge2()arranges bars based on their pre-computed bounding intervals rather than calculating center slot offsets from a dodge span, changingwidthinposition_dodge2()produces no change in the plot output when bar widths are already defined by the parent geom. - Bar widths must be controlled directly via
geom_bar(width = ...).
- Because
- Built-in
paddingandreverseSupport:padding: Adds proportional space between dodged elements at the same x-axis level without requiring manual mismatch of geom and dodge widths.reverse = TRUE: Reverses the left-to-right plotting order of the group variable without needing to alter factor levels.
Demo: width Has No Effect in position_dodge2()
Below, we compare position_dodge2(width = 0.3) against position_dodge2(width = 0.9). Notice that the two plots are completely identical:
# Changing width in position_dodge2 produces identical output
p_d2_w03 <- base_p +
  geom_bar(
    stat = "summary",
    fun = "mean",
    position = position_dodge2(width = 0.3)
  ) +
  ggtitle("position_dodge2(width = 0.3)", subtitle = "Width parameter has no visual effect")

p_d2_w09 <- base_p +
  geom_bar(
    stat = "summary",
    fun = "mean",
    position = position_dodge2(width = 0.9)
  ) +
  ggtitle("position_dodge2(width = 0.9)", subtitle = "Identical layout to width = 0.3")

p_d2_w03 | p_d2_w09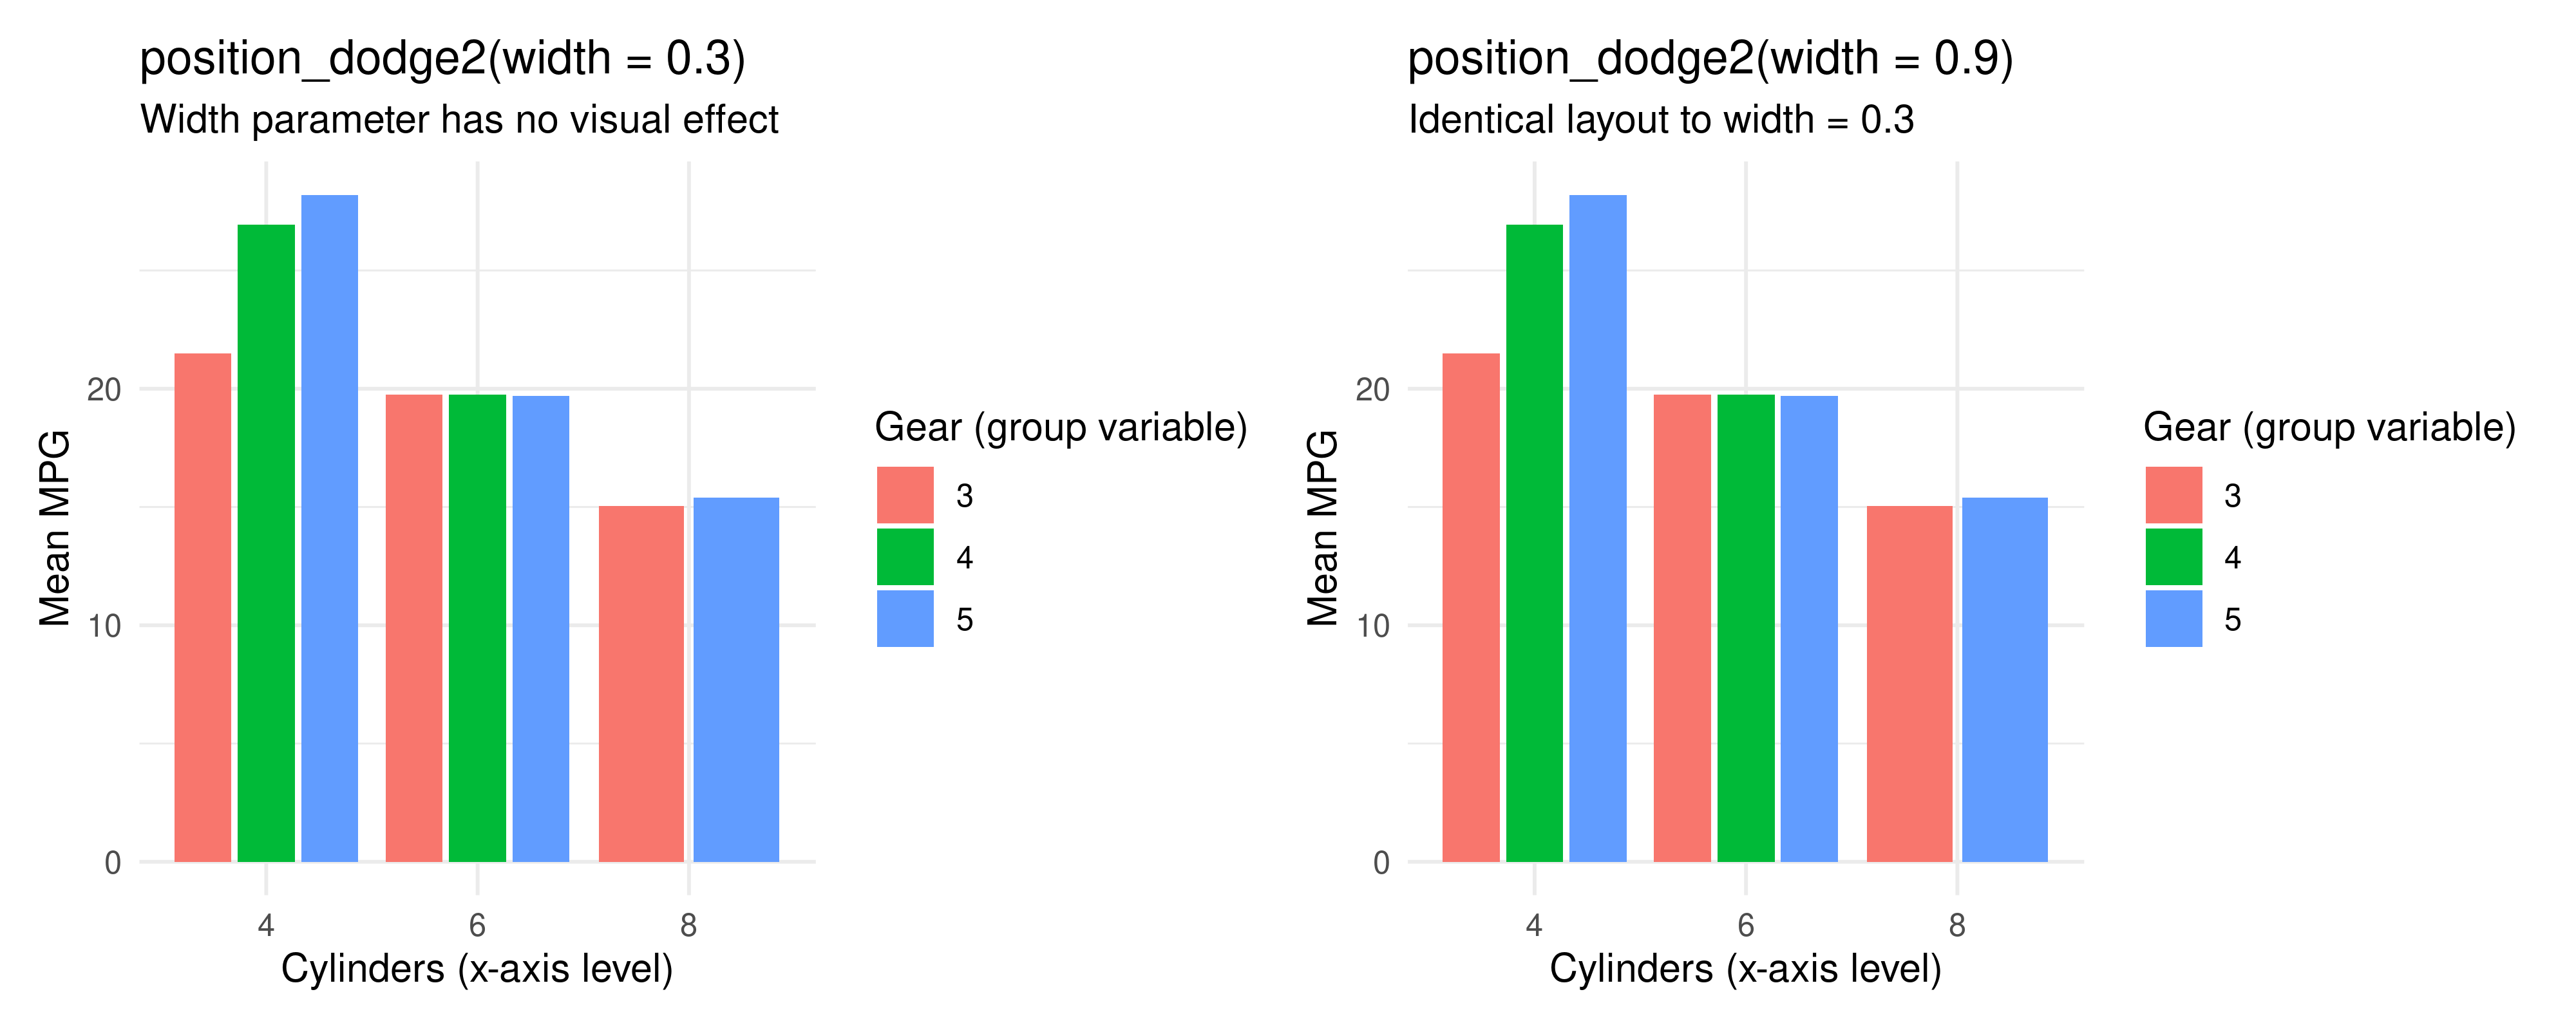
Creating Spacing with padding and Reversing Order with reverse
Instead of altering width, position_dodge2() provides the padding and reverse parameters:
# Using padding and reverse in position_dodge2
p_dodge2_demo <- base_p +
  geom_bar(
    stat = "summary",
    fun = "mean",
    position = position_dodge2(padding = 0.2, reverse = TRUE)
  ) +
  labs(
    title = "position_dodge2(padding = 0.2, reverse = TRUE)",
    subtitle = "Built-in bar padding and reversed order of group variable"
  )

p_dodge2_demo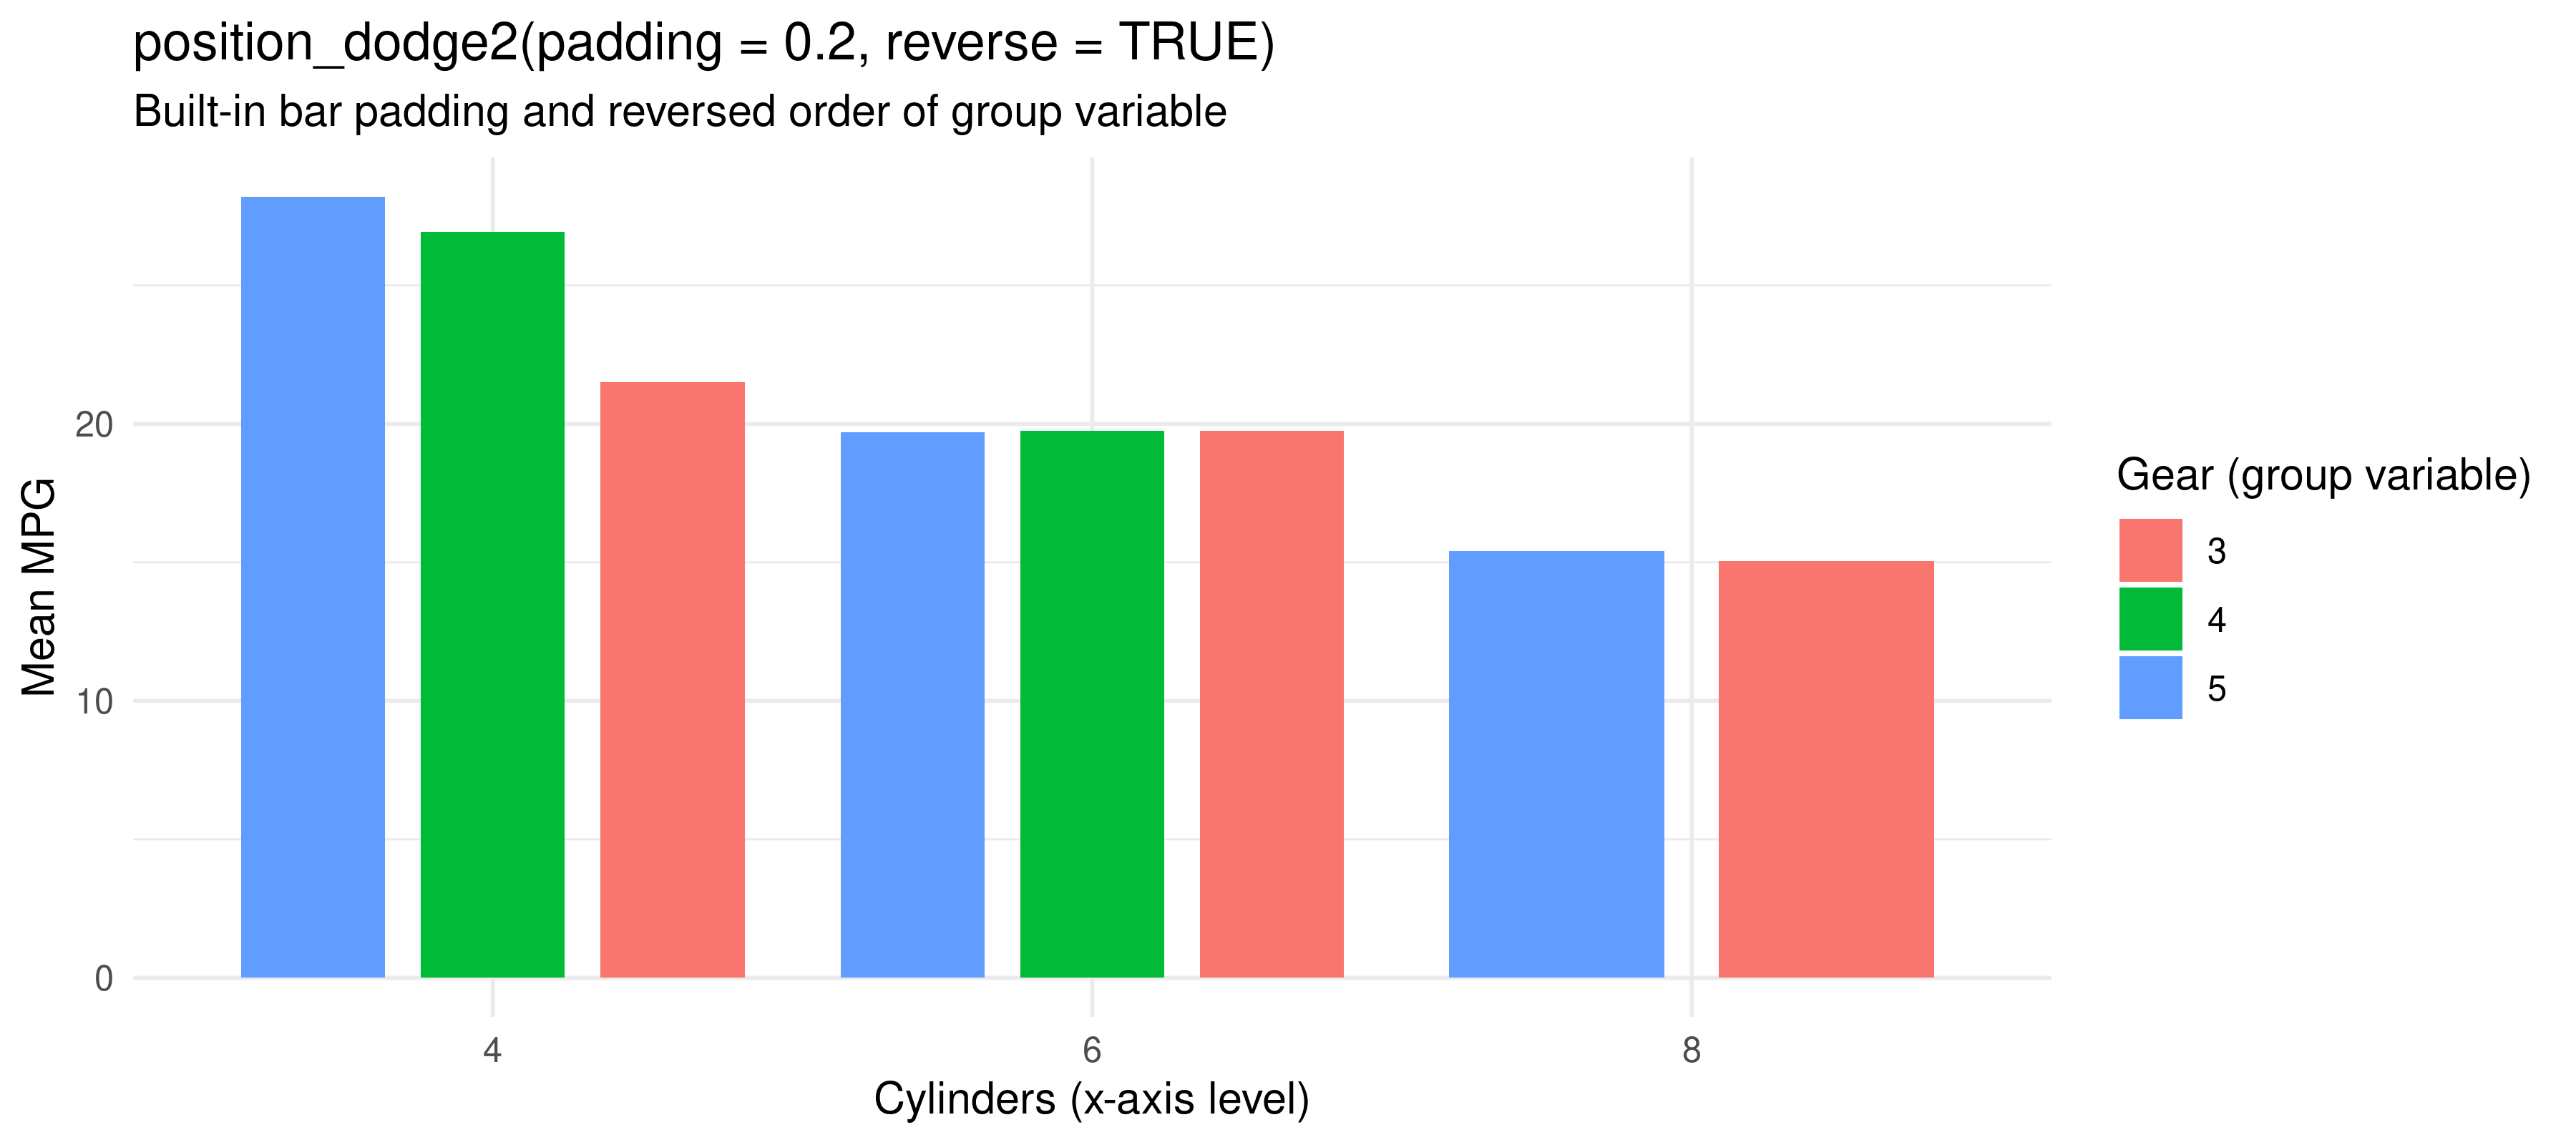
3. Handling Missing Elements with preserve = "single"
A significant functional difference between position_dodge() and position_dodge2() occurs when certain levels of the group variable are absent at a specific x-axis level.
Let’s inspect the count of observations across cyl (x-axis level) and gear (group variable) in mtcars:
table(mtcars$cyl, mtcars$gear)##
## 3 4 5
## 4 1 8 2
## 6 2 4 1
## 8 12 0 2At the x-axis level cyl = 8, the group variable gear contains observations for gears 3 (12 cars) and 5 (2 cars), but gear = 4 is completely missing (0 cars).
When we set preserve = "single" to ensure that all individual bar widths remain uniform across all x-axis levels:
position_dodge(preserve = "single"): Retains fixed slot assignments. Becausegear = 4is missing atcyl = 8, it leaves a blank gap in the middle wheregear = 4would normally reside.position_dodge2(preserve = "single"): Preserves individual bar width while re-centering the remaining dodged elements, packing them side-by-side without leaving an empty gap.
# position_dodge with preserve = "single"
p_dodge_single <- base_p +
  geom_bar(
    stat = "summary",
    fun = "mean",
    position = position_dodge(preserve = "single")
  ) +
  labs(
    title = "position_dodge(preserve = 'single')",
    subtitle = "Leaves an empty gap for missing gear = 4 at cyl = 8"
  )

# position_dodge2 with preserve = "single"
p_dodge2_single <- base_p +
  geom_bar(
    stat = "summary",
    fun = "mean",
    position = position_dodge2(preserve = "single")
  ) +
  labs(
    title = "position_dodge2(preserve = 'single')",
    subtitle = "Re-centers remaining elements (no gap at cyl = 8)"
  )

# Side-by-side comparison
p_dodge_single | p_dodge2_single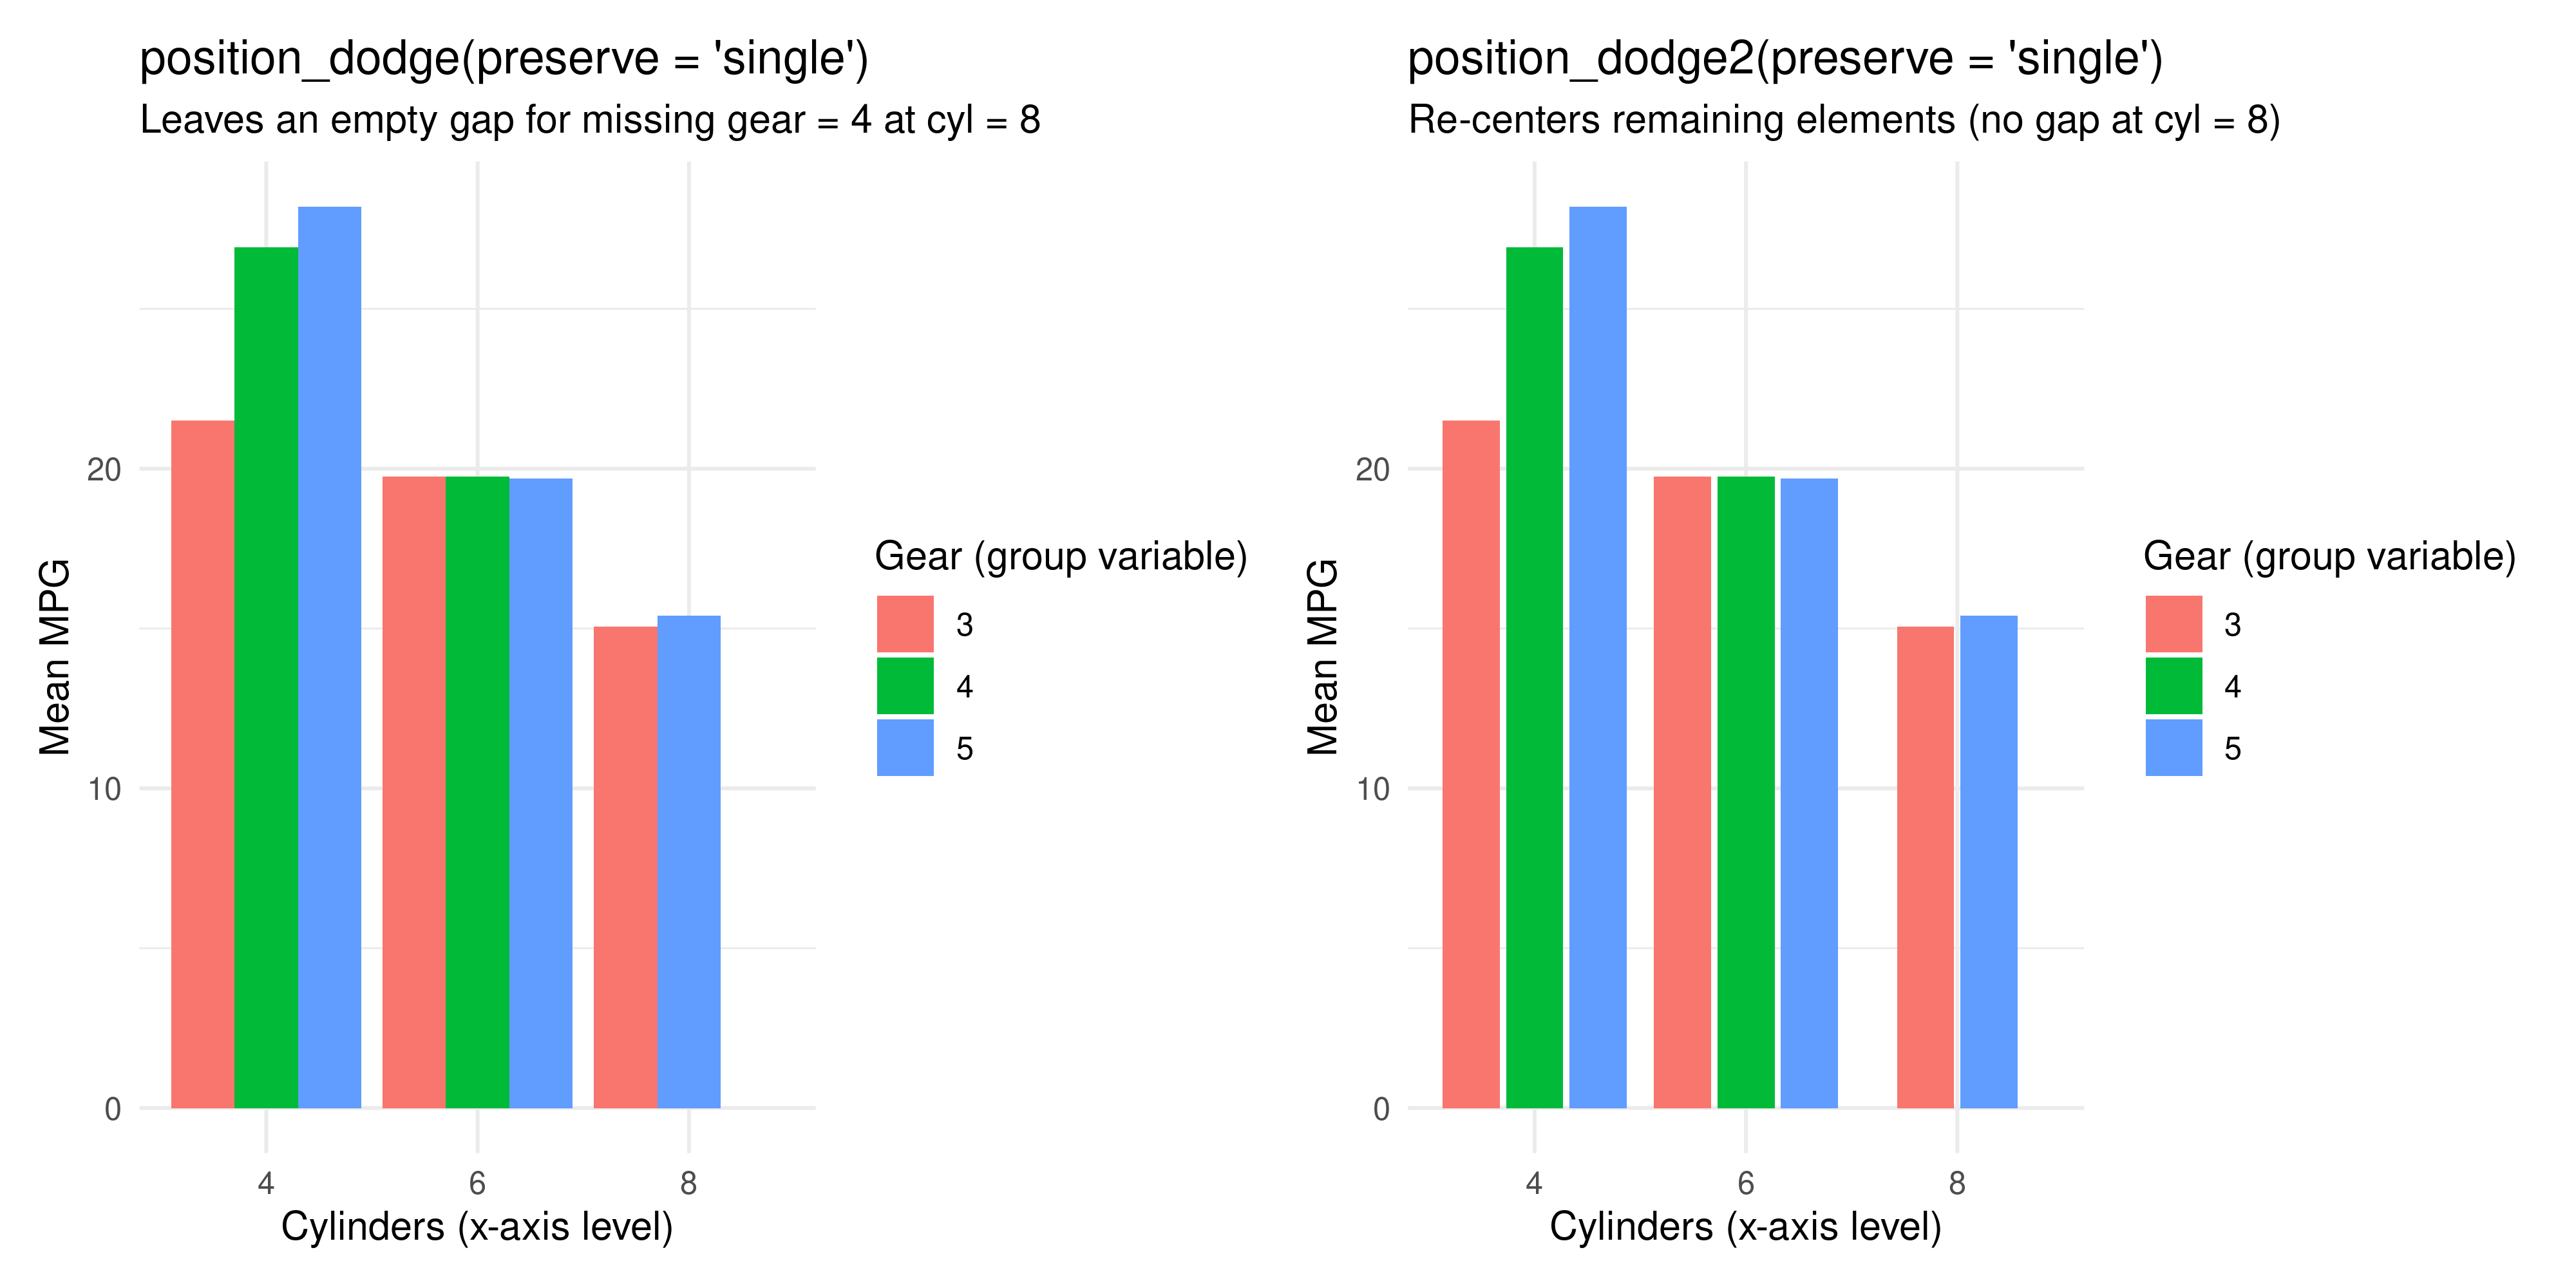
Note that if one sets preserve = “total”, then you would not see any difference, because the bars are re-stretched to ensure the bars from each categorical level occupy all the width assigned to that level.
Summary
| Feature | position_dodge() |
position_dodge2() |
|---|---|---|
| Primary Use Cases | Simple 1D fixed-width geoms (geom_bar, geom_col) |
Interval & variable-width geoms (geom_boxplot, geom_rect, geom_linerange) and bars |
Role of width Parameter |
Sets total dodging span across each x-axis level | Has no visual effect on bars with predefined geom width |
Missing Elements (preserve="single") |
Leaves empty slot / gap at the missing level | Re-centers remaining dodged elements together |
| Padding Between Elements | Manual (geom_bar(width) < position_dodge(width)) |
Built-in via padding = ... argument |
| Reverse Plotting Order | Requires re-leveling the group variable | Built-in via reverse = TRUE argument |
Last modified on 2026-08-30