In ggplot2, the legend keys (the symbols next to the labels) usually inherit their size and appearance from the layers in the plot. For example, if you have a scatter plot with very small points, the legend keys will also be very small, making them hard to see.
To fix this without changing the size of the points in the actual plot, you can use the override.aes argument within guide_legend().
The Problem: Tiny Legend Keys
When plotting many data points, we often decrease the size to avoid overplotting. However, this makes the legend keys tiny:
library(ggplot2)

p <- ggplot(iris, aes(Sepal.Length, Sepal.Width, color = Species)) +
  geom_point(size = 0.5) +
  theme_minimal() +
  labs(title = "Tiny Legend Keys")

p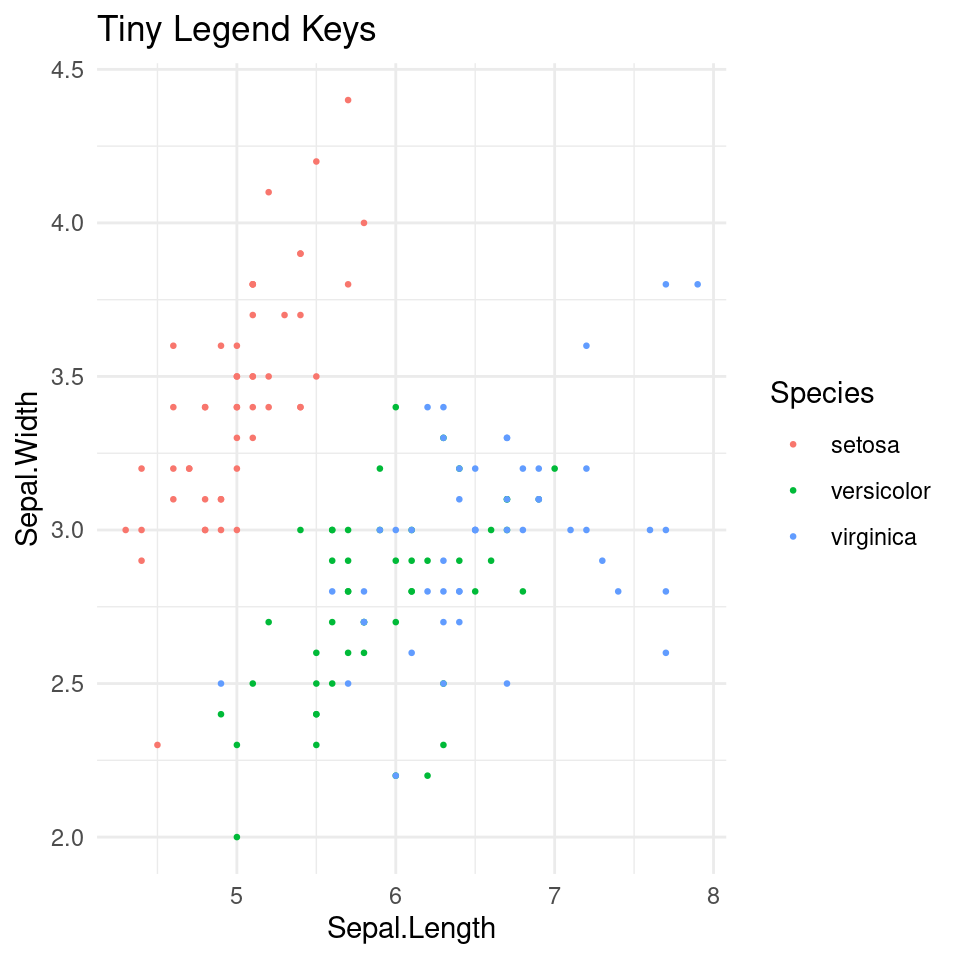
The Solution: Using override.aes
By using guides(), we can “override” the aesthetics of the legend. This allows us to keep the small points in the plot while making the legend keys large and clear.
If your legend is for the color aesthetic:
p_fixed <- p +
  guides(color = guide_legend(override.aes = list(size = 5))) +
  labs(title = "Fixed Legend Keys (Size 5)")

p_fixed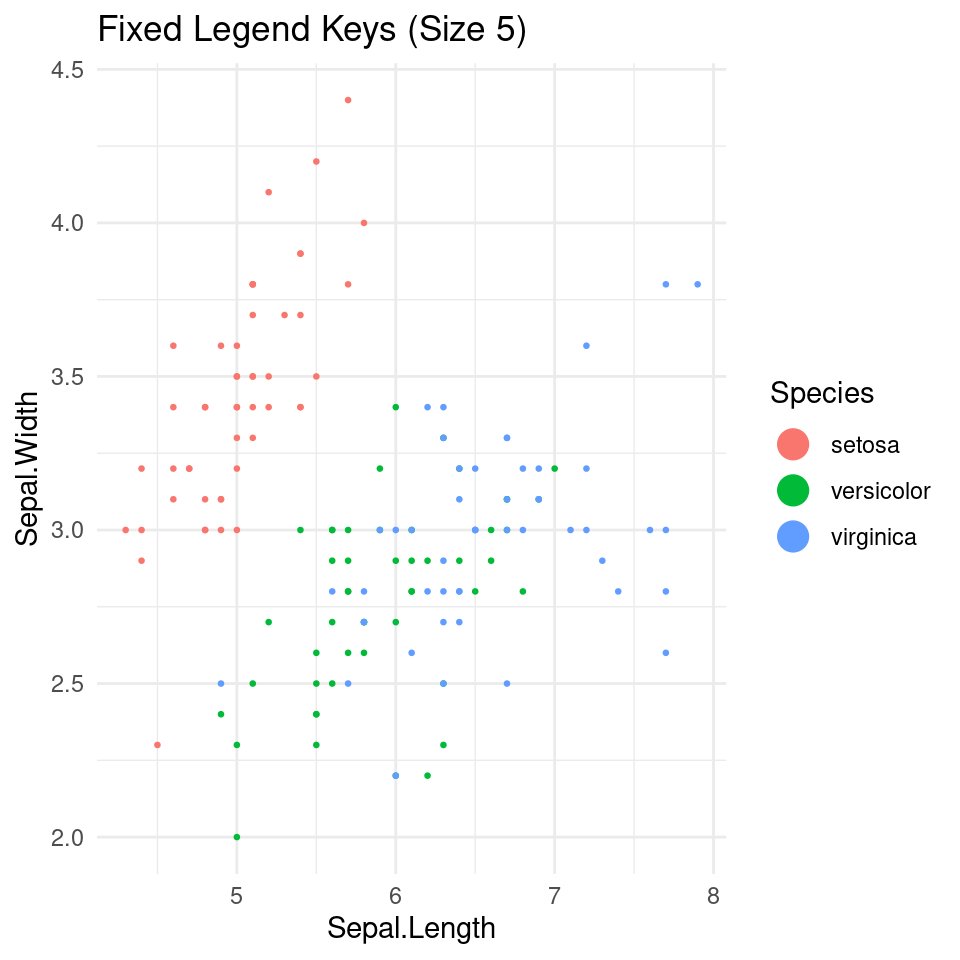
If you were using fill (e.g., in a bar plot or boxplot), you would simply change color to fill:
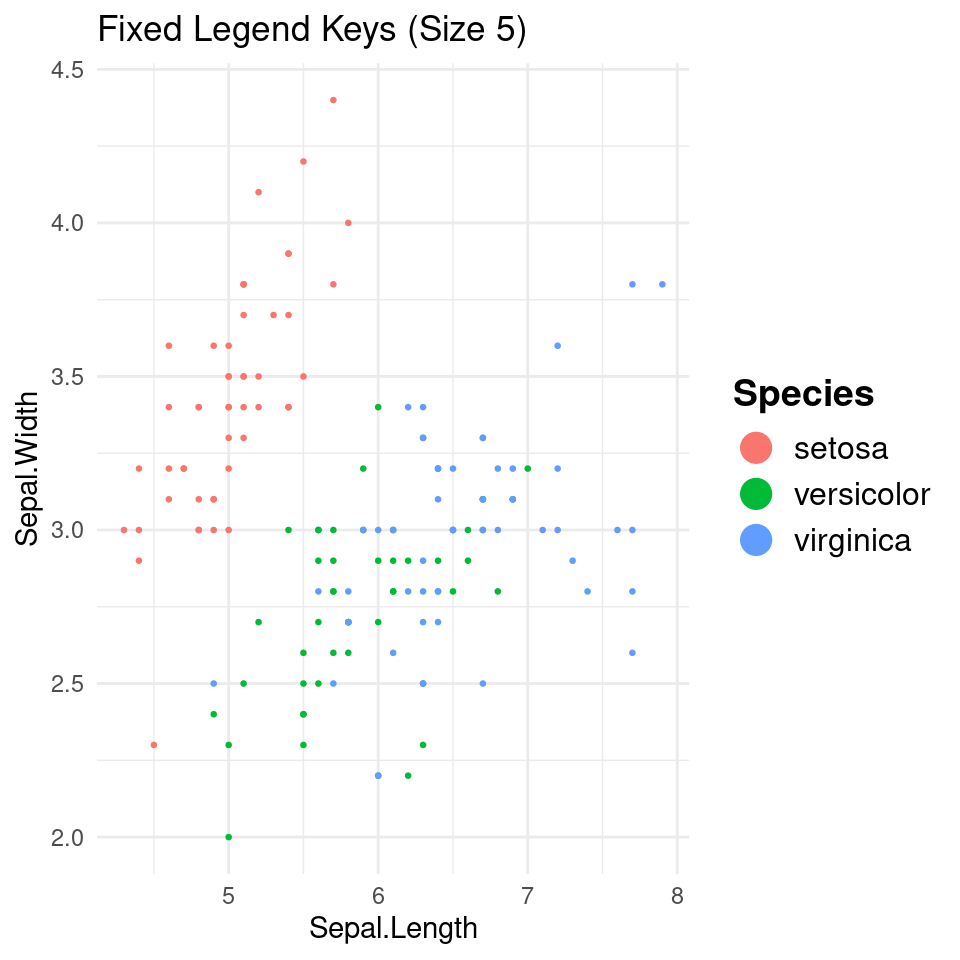
guides(fill = guide_legend(override.aes = list(size = 5)))Adjusting Legend Text and Title Size
Note that override.aes only affects the symbols inside the legend. To change the size of the labels or the legend title, you should use the theme() function:
p_fixed +
  theme(
    legend.text = element_text(size = 12),   # Legend labels
    legend.title = element_text(size = 14, face = "bold") # Legend title
  )
Summary
- Use
guides(color = guide_legend(override.aes = list(size = ...)))to change the symbol size. - Use
theme(legend.text = element_text(size = ...))to change the text size.
Last modified on 2026-04-27